
Motivation.
Solar panels are a great solution to complement the self-hosting hobby. They augment the capacity of concurrent systems runningn without increasing your powerbill, plus, overall lower the cost of your month-by-month power bill.
There are many solutions in the market, generally speaking, they follow the same model, a number of panels and inverters are installed in your home, it gets interconnected to the city's grid, your bill becomes net metered and it's all good.
Most solutions provide means to monitor your power generation and overall system status. The problem with these solutions, lays down the fact that the reporting mechanisms are always a hosted solution, by a third party vendor, subject to the existance/payment on this vendor, which we know, at some point is going to fade away/disappear, If nothing is done preemtively to host these metrics ourselves, when time comes, we will be left without any observability of our own solar solutions.
This post outlines an MVP solution to overcome this, ensuring that data is sent in parallel to the cloud solution whilst storing the metrics in our own hosted server. Minimizing the risk of these vendors to disappear, which has happened and will continue to happen. As example, the dissapearance of the Smart Things Cloud can be read HERE.
Core Objective.
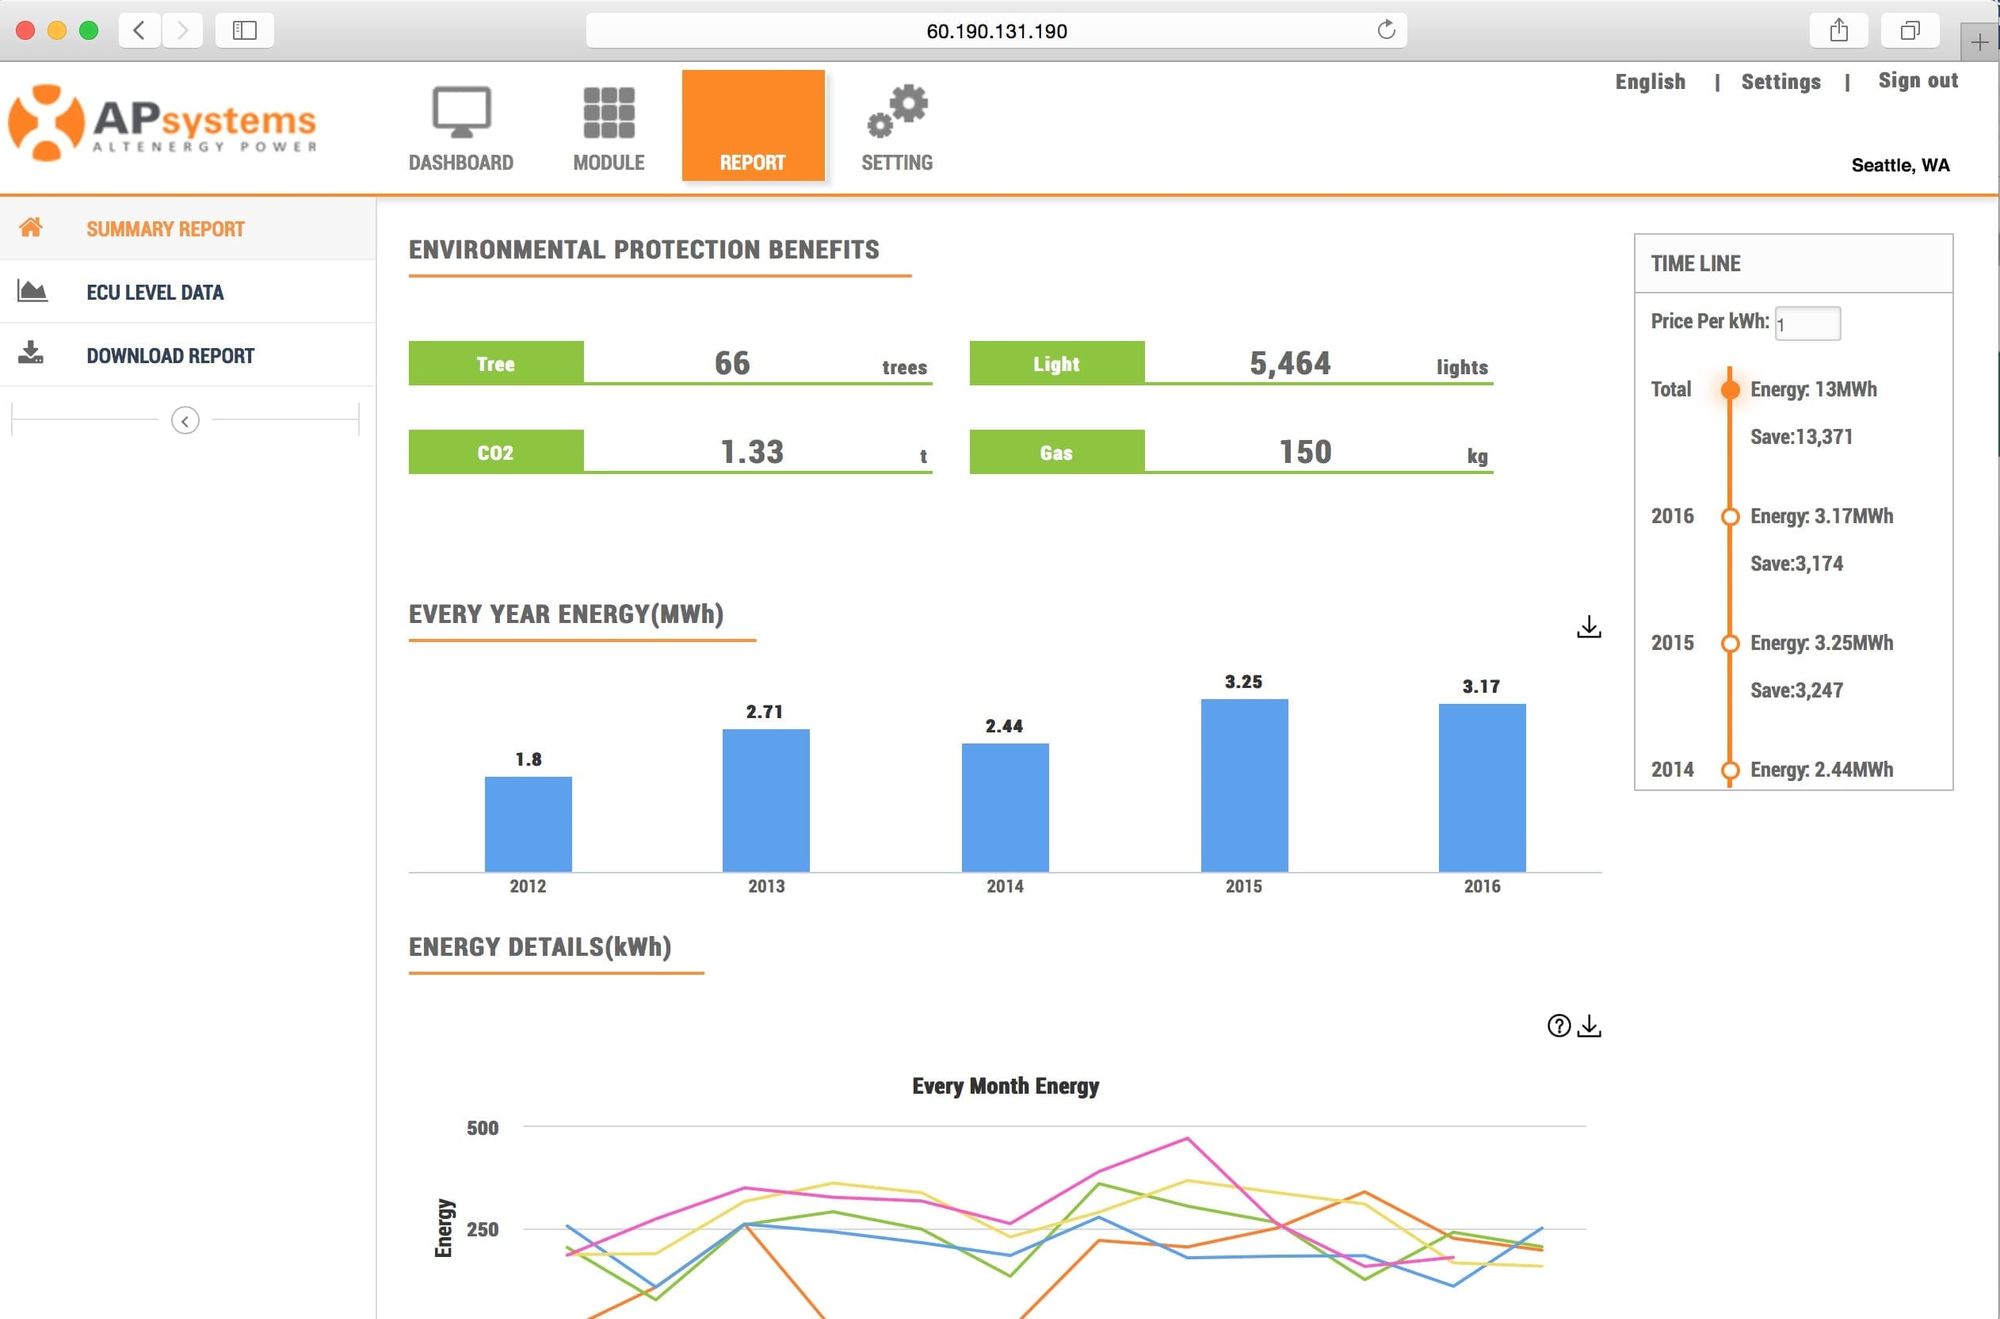
Enable the capture of data generated by the AP Systems Solar solution that enables the vendor portal to run and provide owners information on operation, an example of this dashboard:
To achieve this, we need to:
a. Call the AP Systems ECU device to ingest readings
b. Create payload to InfluxDB
c. Store information in InfluxDB
Required tools.
This MVP was initiated with existing tools at hand, to replicate, you can use:
- Node-Red - Will function as Event Extractor, Transformation and Loading to InfluxDB. Link Here
- Node-Red InfluxDB Nodes - Community created Nodes to enable InfluxDB operations. Link Here
- Node-Red AP Systems ECU Nodes - Community created Nodes to directly talk to the AP ECU, in parallel of their overall cloud operation. Link Here
- InfluxDB - Selfhosted Server, version 1.8 at the time of this writing. Here is an excellent article to install your Influx, Graphana solution.
Instructions.
- Install the InfluxDB Nodes in Node Red
a. Hamburguer menu.
b. Manage Palette.
c. Search AP Systems ECU, InfluxDB nodes in the Search Tab, Install
2. Design the workflow you want the data to flow, both node packages have excellent instructions.
Here's my MVP workflow, for reference:
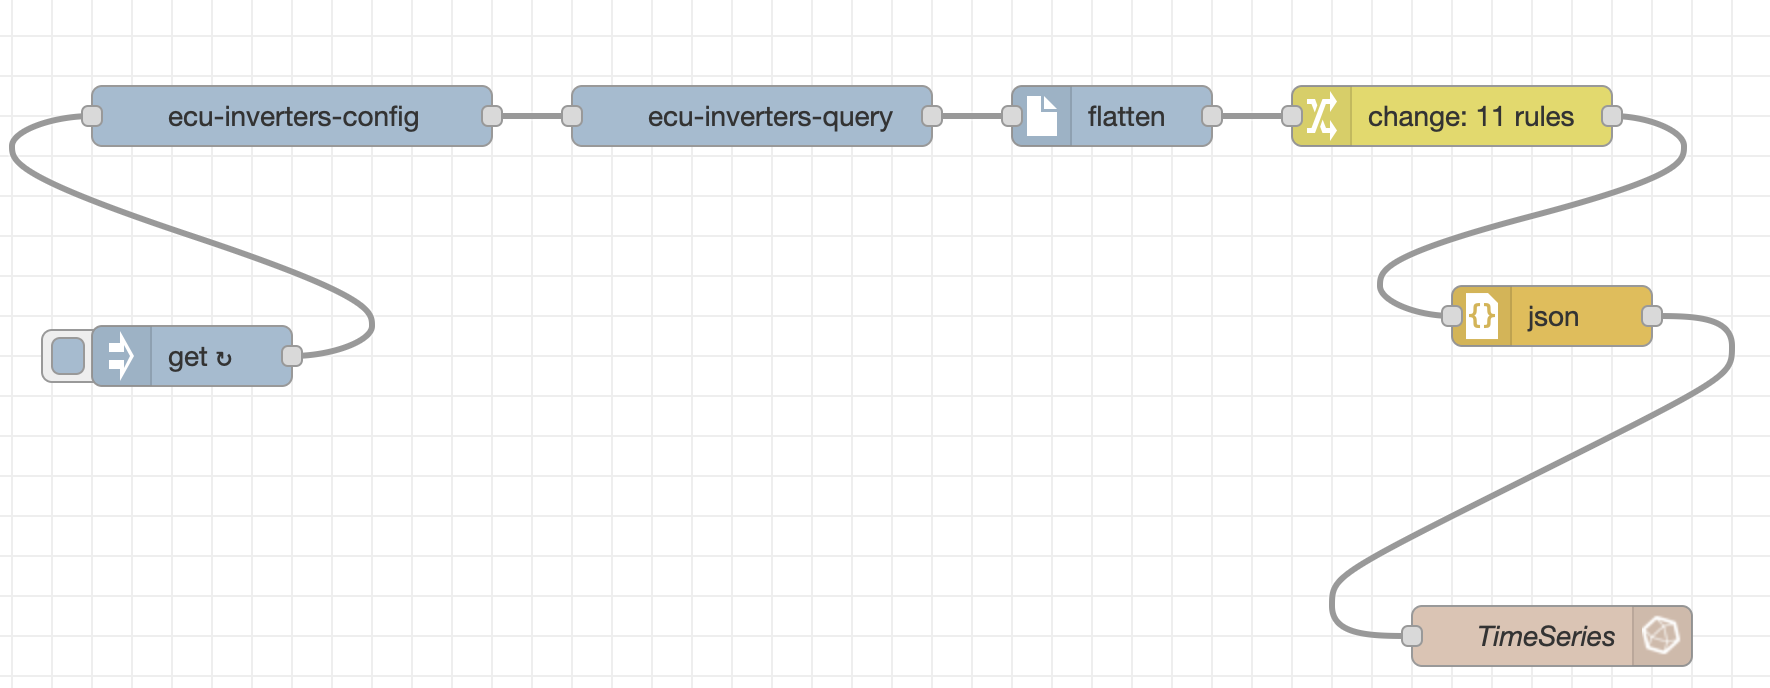
What are we doing with this as of right now?
- Triggering every 15 minutes the flow in the get action
- Configuring the ECU nodes with the local information in the ecu-inverters-config node
- Pulling the latest reading from the ECU with the ecu-inverters-query
- Use the OOB node to flatten the payload to a simple 1 dimension JSON
- Use the OOB Change activity to trim down all irrelevant fields to time series, such as ECU ID, etc.
- Use the json converter to generate a properly outlined payload
- Send to InfluxDB
These steps are high level to encourage you to explore the payload and define what you are looking to get out of your solution, however they are explicit enough to give you the path to go forward.
Results.
After this 2-3 hour project, and fiddling with the Grafana connected to my instance, I am now able to play with Solar Panels information locally, and will not depend on the statistics/service of a third party solution.

